DATA ANALYTICS AND VISUALIZATION
Picture speaks louder than words !!
Presenting accurate results and showcasing them is very crucial in the digital world. People will not take your words for place value. A concrete statistical or numerical representation is considered legit, and for that, Data Analytics and Visualization are a must.
We often misunderstand Data Analytics and Visualization to be a single term, while they are closely interrelated, so much so that some people fail to differentiate between them, these are two completely different terms.
Data Analytics is a method of thoroughly examining sets of data, be it structured or not. It then gathers information regarding various factors such as the company’s search statistics, its competitor’s performance, audience review, and market performance.
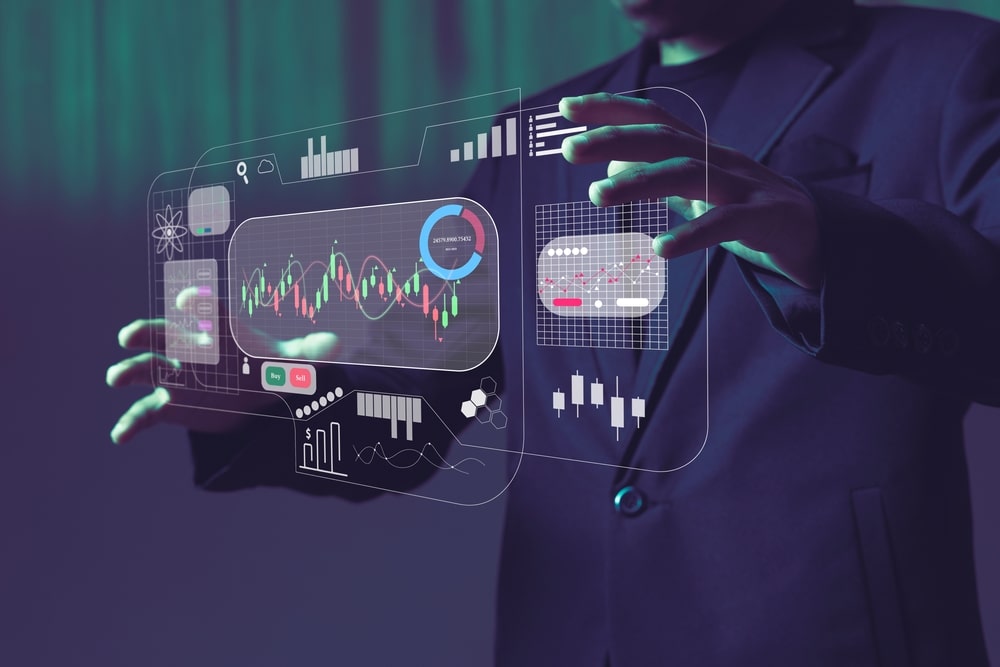
Data visualization is a graphical representation of the data. It involves producing visuals that communicate relationships among the represented data to viewers of the visual objects. It helps build a story.
We believe that we should now and then adapt to changes. Our ultimate goal is to render our clients entirely data-driven, so they do not have to walk a path of uncertainty. No matter which stages you are in your journey, whether you want guidance on considering specific tools of your choice, to assist you on every step of data collection and evaluation to create the optimum data-driven experience for you on your preferred platform, we can jump in be your partner. After an initial assessment, we will help you understand every aspect of your company’s performance & use analytics into a long lasting advantage for you.
Now let’s talk about Data Visualization. It is more about the users rather than the company itself. The main goal of visualizing data is to communicate crucial information with the best transparency, i.e., the information we convey has to be absolutely user friendly and very visual.
A balance is necessary while relaying information, and it isn’t always easy to find. Think Evolve Consultants will help you manage your data visualization to be very comprehensive and appealing to a wide range of users. We take precision, error, and collision of data under strict consideration to build a visual information structure that captures the user’s attention sequentially. Scattered information is bound to fail since users may not have the technical knowledge to connect the dots, they might have the precision, but nothing will work if it doesn’t make sense to the users. We will help you with the following terms in general:
Understand products and their categorization
Predict sales volume
Predict Consumer behaviors
Point out areas that need attention/improvement.
Create insights to be used for business decisions.
Our ultimate goal is to understand your business thoroughly, the components that build it, its digital model, the analog model, and the company’s implemented strategies and methodologies. By understanding the company entirely, we will share recommendations on your industrial goals and your personal goals within the industry and help you create differentiation for your business. We will ensure you get a substantial push by implementing analytics and infographics to your advantage and allow you to use them as a reference & guide in all your decisions.